Thursday, April 12, 2007

Old Map--New Map

Cartography has changed greatly from the times of hand-drawn parchment maps and compass navigation. Historic maps are exceptional examples of hard work and dedication to the art of mapmaking. But they can also help to describe how far cartography has advanced since then. Even within the last decade and a half, the change in cartographic techniques and technology has been dramatic. That is why I want to look at an example of what I would currently consider an old map (a simple Nevada highway map) and compare it to what I would consider a new map (a Google Earth satellite/road hybrid map). Below are examples of these two kinds of maps:
The “old” map is good if all you need to know is which road will take you to which city. It is not a bad map, it just has limited uses. The “new” map provides a better sense of the landscape, and the mixing of satellite imagery with a roads layer on top just looks really cool. The hybrid map shows how far cartographic technology has come. This new mapping technology is so advanced, and yet it can be utilized with a free download to a personal computer.
The Nevada highway map is advanced compared to historic maps, but seems old and out-dated itself when compared to the new technology we have at our disposal in today’s modern cartographic world. Below is an example of a historic map from the UNLV Library website:
This historic map demonstrates how far the other two examples have come in terms of accuracy and applicability, and how far cartography has come in general. Hand-drawn maps are a thing of the past and computer technology has provided the world of cartography with a new pencil and pad of paper (or should I say mylar).

Thursday, March 1, 2007

Mapping the News


MAPPING THE NEWS
Maps serve several different purposes as can be seen in some of the previoius posts of this blog. They can be used as references like in atlases, roadmaps, or You-Are-Here maps in malls to help people find their way. They can be used aesthetically as a compliment to a company logo or on a brochure or pamphlet. But maps can also tell a story or provide supporting evidence to a story. That is why maps are often used by news agencies—broadcast, print, and web-based.
Maps in the news can be used for reference purposes. For example, when an accident occurs a map may be used to show where it occurred, or a newspaper might print a story about a particularly dangerous intersection and use a map to display where that intersection is. Here are two examples of this kind of news map: From a Reno Gazette Journal story (see the bottom of the article), and from an Ames, Iowa article. Thematic maps are also used by news agencies to help support the point of a news story. This website, posted by the University of New York, Buffalo, has a lot of good examples of thematic maps used in the news. A few are below:


Map of U.S. Pollen Seasons
Aventis Pharmaceuticals Seasonal Allergies p. 8-9


Map of Mountain Lion Attacks in U.S.

This was from an article in Discover magazine about mountain lion attacks. "The moutain lion is the most widely distributed large predator in the western hemisphere. Since the 1960s, bag limits have replaced bounties and lion populations in the United States and Canada have grown to around 15,000 spreading even into some suburbs. Of the 17 fatal and 68 nonfatal attacks on people since 1890, a disproportionate number (above) have occurred within the past decade."--Caption. Source: "Is That a Mountain Lion in Your Backyard?" Discover 22:6 (June 2001): 63.


I found an interesting website posted by the Arizona Daily Star from Tucson, Arizona. It is titled Mapping the News, so I felt compelled to include it in this weeks blog assignment. It is an interactive world map with a drop-down list of countries. If you choose a country, a window pops-up and gives a short demographic breakdown and history of the country and also provides a timeline of recent major news events from that country. It is pretty cool you should check it out here.

Thursday, February 22, 2007

Interactive and Animated Cartography

ARTICLE ABOUT INTERACTIVE/ANIMATED CARTOGRAPHY
This research article is about an exploratory data analysis software system that has been developed by the authors of the article. The software is called Descartes. Descartes (formerly called IRIS) is a software system designed to support visual exploration of spatially referenced data such as demographic, economic, or cultural information about geographical objects or locations such as countries, districts, or cities. Descartes offers two integrated services: automated presentation of data on maps, and facilities to interactively manipulate these maps. This software allows for the creation of automated maps and maps that users can interact with by manipulating data or parts of data sets. The article has many good tables and example figures describing how to make decisions about how to visualize and symbolize data types, how to choose the right combination of visualization types, and an example of the look and feel of the software. The article concludes by expressing the hope that they made more clear the idea of what interactive and animated maps are and why they are useful. Here is a link to the article.


EXAMPLE OF INTERACTIVE MAP WEBSITE
The web site I found that uses interactive mapping is MapQuest. It creates maps and directions for locations chosen and entered by a user. MapQuest allows users to enter a location name, a street address or intersection, or a city or zip code and then creates a map of that area. It also allows users to enter a beginning location and a destination and then draws out direction on how to get to the destination.
Here is a link to the page of direction from my House in South Reno to the University.

Thursday, February 15, 2007

Maps and the American Identity


America enjoys feeling like it has its own unique idenity. That identity might be best described as HARD-WORKING and FUN-LOVING. Lake Tahoe has developed its own unique identity within the American landscape. It is a community that spans two states, California and Nevada. These two states have worked together in creating a unique identity for the lake community they share. The identity of Lake Tahoe is based in recreation, relaxation, and unmatched scenic beauty; it is America’s Adventure Place. It is an area known for its year round recreational possibilities. One might say that Lake Tahoe has focused its efforts in appealing to the FUN-LOVING American identity.
The Tahoe community has made efforts to advertise its recreational identity, and has succeeded in expressing that identity to the nation. One way Tahoe has accomplished this is through maps which display the winter, summer, spring, and fall activities Tahoe offers. These maps are posted on the internet at Tahoe visitor websites. Tahoe.com, VisitingLakeTahoe.com, SkiLakeTahoe.com, and VirtualTahoe.com are all examples of these visitor sites and all of them have maps of Tahoe. All of the maps seem to exclusively show where at Lake Tahoe people can find recreational activities. From skiing and other winter sports to boating, kayaking, and beach-going to nightlife and gaming, all these maps highlight the recreation Lake Tahoe has to offer. There is so much to do at Lake Tahoe, and these maps help show that to those who are considering visiting the region.
Maps are a good way to express the identy of a region. The identity of the Lake Tahoe community is recreation. Tahoe has become world-famous for it, and these various maps work to express that identity.

Thursday, February 8, 2007

Map Fact/Map Fiction

All maps are a form of fiction. Maps are only representations of the real world and so they are inherently fiction based. For one thing, they are flat and the earth is round. Any attempt to display a round, three dimensional object on a flat, two dimensional surface results in the distortion of the size, shape, or distance between features. Secondly, maps are only representative of some very small portion of the infinite amount of detail that our world contains. Any map must generalize the real world. Rivers and streets are turned into smooth lines and entire cities are left to be represented by single points. There is no map that is completely truthful about every aspect of a region.
With that said, maps can be used in attempts to portray spatial information as accurately as possible or they can also be used in attempts to inaccurately skew spatial information. How maps are designed and what data is included or left out often determines what impression a map will give an audience. It is left up to the cartographer to either accurately or inaccurately portray data dependent on their, or their organizations, goals for a given map. The goal of a map that is to be published in an atlas is very different from the goal of a map that is to appear in a newspaper or magazine article. The goal of an atlas map is to portray spatial data about one or many regions as accurately as possible. This is often done by using all of the data that has been gathered without concern for the way the region will be depicted by that data. Maps in atlases are the closest to what I would consider “map fact,” taking into account that in an atlas there is generally no deliberate attempt to mislead people about the characteristics of a region.
Maps to be published in a newspaper or magazine have the goal of supporting the information contained within the article or feature to which they are paired. This often involves including some information while neglecting other information. This is not due to constraints of space (which is sometimes why things are left out of a map), but due to the desire to highlight those things that support the point a writer/cartographer is trying to make by using a map.
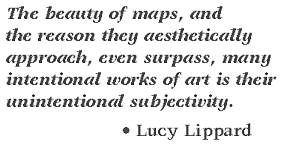


This quote by the well-known author, theorist, and art critic, Lucy Lippard, is very true. However, the subjectivity of maps can also be intentional. Maps are only a subjective view of the objective world, and that subjective view is intentionally or unintentionally shaped by a map’s creator. No map is entirely truthful. Some maps/mapmakers do attempt to come close to depicting the truth, while others have the goal of leading an audience towards their own interpretation of what is true.

Thursday, February 1, 2007

The Importance of Overall Map Design: GOOD MAP/BAD MAP

Overall map design is a very important part of producing a quality cartographic product. If a map is poorly designed, then it really doesn’t matter how good the information it displays might be. The purpose of a map is to display spatial information in a format that is easy for an audience to read and understand. If an audience cannot read a map, or has trouble making sense of it, then that map has failed in that purpose.
Map design involves the inclusion of necessary map elements such as: a succinct title, an indication of scale, a north arrow, a neatline, a map legend or proper labeling, and a proper citation or source statement. Map design also involves the balanced organization of these elements within the map. A good map should not have large areas of empty or dead space. Maps should also be designed with a visual hierarchy that makes the most important elements of the map (the map itself, the title, etc.) the largest and most clearly visible parts of the map.

This is an example of a poorly designed map that I found on the internet. It is a township map of Okemos, Missouri used in a recent county meeting. While it would have been created knowing that those who would be viewing it would be familiar with the area that was displayed, it still lacks almost every important map element. It has no title, it has no indication of scale or which direction is north, and it has no legend. While the roads, lakes, towns, and rivers are labeled, there are what I can only assume to be railroad tracks that have no label. The roads are no different in color from the railroad tracks making them hard to tell apart. This map also lacks an indication of who created the map or where the information for the map came from. This map has plenty of room to place a legend and north arrow on the left side and a scale bar below. There is also room for a title at the top. This map is probably good enough for the limited audience of a county meeting, but there is really no reason for such important map elements to be left out. The lack of those elements leads to a poorly designed map that many audiences would have a hard time figuring out.